


There is a wealth of EV manufacturing statistics scattered across industry press releases, research-firm forecasts, and government datasets. Together, they tell a full, thriving story spanning decades. However, these numbers rarely share definitions. Production figures and sales figures get treated as the same thing more often than they should, even though they measure different events.
This guide pulls the numbers into one sourced reference: where EVs are built, who builds them, what they cost, and where the supply chain carries the most risk. Every figure below links straight back to where it came from, and where credible datasets disagree, that disagreement is shown rather than smoothed over.
How this article sources its data
Headline figures draw on Tier 1 and Tier 2 sources: the IEA, ICCT, IFR, BloombergNEF, S&P Global Mobility, SNE Research, Oliver Wyman, Environmental Defense Fund, and company filings. Market-sizing forecasts, where they appear, come from commercial research firms and carry a methodology note where the numbers diverge. Trade press is used for context, never as the sole source for a key claim.
How Many EVs are Being Manufactured?
Global EV output has scaled faster than almost any manufactured product in modern history. The world built almost 22 million electric cars in 2025, more than 25% up on 2024, and China alone accounted for nearly 75% of that total, according to the IEA’s newest Global EV Outlook. That share is up from the roughly 70% China held in 2024.
Global EV Production Over Time
The IEA reports production; the ICCT reports sales. The two diverge, so read the figures below as production unless noted.
| Jahr | Global EV Production | YoY Growth | Anmerkungen |
|---|---|---|---|
| 2018 | ~2.3 million | , | Early-adoption phase |
| 2020 | ~3.2 million | +5% | Pandemic-slowed growth |
| 2022 | ~10.5 million | +55% | Mainstream inflection |
| 2023 | ~14 million | +33% | IEA Global EV Outlook 2024 |
| 2024 | 17.3 million | +25% | IEA Global EV Outlook 2025 |
| 2025 | ~22 million | +25%+ | IEA GEVO 2026 |
| 2026 (forecast) | ~23 million | ~5% | IEA forecast, ~30% of car sales |

Sources: IEA Global EV Outlook 2024, 2025, and 2026.
Use of this image is permitted with a reference/backlink to this page.
The Production-Versus-Sales Gap
The IEA counted almost 22 million electric cars produced in 2025, while its own sales tracking put global electric car sales at just over 20 million for the same year. That gap shows up most clearly in China’s export numbers: domestic production outstripped domestic demand by around 20% in 2025, which is exactly why Chinese EV exports doubled to a record high of more than 2.5 million vehicles that year. The summary is that anyone reading a production figure as a demand signal might be overstating the market by a meaningful margin.
BEV Versus PHEV: A Widening Split
The split between fully electric and plug-in hybrid production shapes battery demand more than any other single variable. It is moving toward BEVs almost everywhere except the markets with the thinnest charging networks. In the first half of 2025, battery electric vehicles made up roughly 18% of new light-duty vehicle sales against 9% for plug-in hybrids across the ICCT’s tracked markets. This means BEVs are outselling PHEVs roughly two to one where both are counted together as “electric.”
Even inside a single company, the pattern holds: BYD’s own BEV sales rose 27.9% in 2025 while its PHEV sales fell 7.9%, inside a company that sells both in roughly equal volume. Hybrids still do heavy lifting in markets with thin charging infrastructure, but the direction of travel is unambiguous.
EV Manufacturing by Country
Investment announcements and actual production share have been moving in opposite directions for two straight years now. That gap is the single most important thing to understand about the current geography of EV manufacturing.
China: The Manufacturing Superpower
China’s lead is a fifteen-year head start compounding on top of the world’s largest domestic EV market. In 2025, China built 16 million electric cars, nearly 75% of everything the world produced, and supplied more than 80% of the world’s battery cells on top of that. Domestic output ran 20% ahead of domestic demand, which is the mechanism behind the export surge described above.
The country’s own manufacturers are now aiming higher still: the ten largest Chinese OEMs have announced combined overseas sales targets exceeding 7 million vehicles for 2026, nearly double what they targeted for 2025.
Yijin-Lösung runs its Shenzhen manufacturing base inside this production ecosystem, supplying precision components to the cluster that builds most of the world’s EVs.
Europe: A Battery Industry Still Finding its Feet
Europe’s 2024 production held essentially flat: the European Union built 2.4 million electric cars, a stall rather than a decline. The region is attempting to establish its own position within the battery supply chain. Northvolt, once the continent’s best-funded attempt at a homegrown battery champion, filed for bankruptcy in Sweden on 12 March 2025. This comes after burning through more than $13 billion in debt and equity without ever reaching planned output at its flagship Skellefteå plant. Its assets were sold off to the US lithium-sulfur firm Lyten later that year.
The contrast is France’s Verkor, which has taken the slower, single-site route: its Dunkirk gigafactory was producing at roughly 8 GWh of an eventual 16 GWh capacity as of September 2025, enough for around 300,000 cars a year once fully ramped. It is a smaller bet, but a live one, and the difference between the two companies is basically the lesson Europe’s battery industry is still learning.
North America: Record Investment, Falling Share
North America shows a genuine paradox, and it is worth sitting with rather than resolving too quickly. On one side, manufacturers have announced $197.6 billion in US EV and battery manufacturing investment over the past decade, spread across 229 distinct projects at 208 facilities. This is with 57 of those already in production supporting more than 50,000 jobs and over 100 more under construction.
On the other side, the US share of global EV production fell from 7% in 2024 to 5% in 2025, according to the ICCT. It attributes the drop to automakers pulling investment and delaying production as the policy environment shifted. Money committed and market share held are, it turns out, two different curves.
Mexico, meanwhile, is quietly absorbing the difference. Mexican EV output doubled in 2024 even as US production slipped, and roughly 70% of that Mexican output came from US-headquartered manufacturers taking advantage of lower manufacturing costs just across the border.
Asia-Pacific (ex-China): A Diversification Play, Not Yet a Rival
Production across the rest of Asia-Pacific rose 15% in 2024 to reach about 1 million electric cars, led overwhelmingly by incumbent Japanese and Korean carmakers rather than new entrants. That is real growth, but it reads as supply-chain diversification rather than a genuine challenge to China’s position: the region still absorbs far more Chinese-built EVs than it manufactures of its own.

Use of this image is permitted with a reference/backlink to this page.
Top EV Manufacturers
BYD Overtakes Tesla
BYD closed 2025 with 2,254,714 battery electric vehicles sold, a 27.9% jump on 2024, against Tesla’s 1,636,129, down roughly 9% on the year. It marks BYD’s second consecutive year of growth set against Tesla’s second consecutive year of decline.
| Metrisch | BYD 2025 | Tesla 2025 | YoY change |
|---|---|---|---|
| Battery-electric vehicles sold | 2,254,714 | 1,636,129 | BYD +27.9% / Tesla: ~-9% |
| Total NEV sales (incl. PHEV) | 4,550,036 | 1,636,129 (BEV-only) | , |
| Overseas BEV sales | Over 1 million, first time | , | +150% YoY |
Sources: BYD and Tesla company disclosures, via Electrek, January 2026.
Worth noting for anyone building a model off these numbers: BYD’s own BEV/PHEV split has moved to roughly 50/50 for the first time, with PHEV sales actually falling 7.9% even as the company’s total volume grew, which says something about where its own product mix is heading regardless of what the wider market does.
EV Battery Manufacturing
The battery remains the single largest cost in an EV and the most contested manufacturing segment in the industry. Two facts anchor everything else in this section: CATL and BYD together hold well over half of global installations, and the price of the underlying cells keeps falling even when metal costs rise.
Battery Production: Who Makes them
| Rang | Unternehmen | Land | 2025 Share | Installations (GWh) | YoY |
|---|---|---|---|---|---|
| 1 | CATL | China | 39.2% | 464.7 | +35.7% |
| 2 | BYD (FinDreams) | China | 16.4% | 194.8 | +27.7% |
| 3 | LG Energy Solution | Südkorea | 9.2% | 108.8 | +11.3% |
| 4 | CALB | China | 5.3% | 62.8 | , |
| 5 | Gotion High-Tech | China | 4.5% | 53.5 | +82.5% |
| 6 | SK On | Südkorea | 3.7% | 44.5 | , |

Source: SNE Research, via CnEVPost, February 2026 (full-year 2025 data).
CATL and BYD together control 55.6% of global battery installations, and CATL alone has grown its share every year since 2023, from 38.0% in 2024 to 39.2% in 2025. Total global installations crossed 1,187 GWh for the year, up 31.7% on 2024, the first time the industry has cleared that mark.
Use of this image is permitted with a reference/backlink to this page
Sources: Company filings, Statista, Electrive, IEA GEVO 2026, CKGSB, Contrary Research.
Battery Pack Prices
Falling pack prices are the strongest structural driver of EV adoption there is, and 2025 kept the trend intact despite a genuine headwind. Global average pack prices fell to $108 per kilowatt-hour, an 8% drop on 2024 and 93% below 2010 levels, according to BloombergNEF’s annual survey. What makes that number more impressive than it first looks: cobalt and lithium prices both rose in 2025, cobalt sharply after the Democratic Republic of Congo introduced export quotas, and the industry absorbed the shock through LFP adoption, long-term contracts, and hedging rather than passing it through.
| Segment / Region | 2025 Average Price | Change on 2024 |
|---|---|---|
| Global average (all segments) | $108/kWh | -8% |
| China’s average | $84/kWh | -13% |
| North America (vs. China) | +44% | -4% |
| Europe (vs. China) | +56% | -8% |
| BEV packs specifically | $99/kWh | 2nd year under $100/kWh |
| LFP chemistry (all segments) | $81/kWh | , |
| NMC chemistry (all segments) | $128/kWh | , |
| Stationary storage | $70/kWh, cheapest segment for the first time | -45% |
Source: BloombergNEF, 2025 Lithium-Ion Battery Price Survey, published 9 December 2025.
Price parity between EVs and combustion cars, on a sticker-price basis, is real in China and nowhere else yet. That distinction matters more than the headline number, because “parity” gets used loosely across industry coverage without anyone specifying which basis they mean.

Use of this image is permitted with a reference/backlink to this page
Sources: BloombergNEF 2025 Battery Price Survey.
Battery Overcapacity and the Gigafactory Build-Out
Overcapacity cuts two ways: it is what let the industry absorb 2025’s metal-cost shocks without raising prices, and it is also the reason Northvolt and a handful of others did not survive. Benchmark Minerals’ gigafactory assessment counts more than 240 operational gigafactories worldwide, a number it expects to pass 400 by 2030 at a combined pipeline capacity of roughly nine terawatt-hours. That gigafactory count is a live figure rather than a fixed one, and Benchmark updates it as new plants come online.

Use of this image is permitted with a reference/backlink to this page
Automation and Robotics in EV Manufacturing
Robots sit at the center of both EV quality and EV cost. They are the direct answer to the labor-cost gap.
Global Robot Deployment
542,000 industrial robots were installed worldwide in 2024, the second-highest annual total on record and more than double the figure from a decade earlier. Total operational stock worldwide reached 4.664 million units, up 9% year on year, and the IFR expects 575,000 new installations in 2025 and more than 700,000 by 2028.
China’s Robot Dominance
China both installs and, increasingly, builds its own robots. The country installed 295,000 units in 2024, a record and 54% of global demand, and for the first time Chinese-made robots outsold foreign suppliers domestically, taking a 57% domestic share, up from about 28% a decade ago. China’s operational stock passed 2 million units in 2024, the largest of any country.
Automotive-Specific Automation in the US
The US picture is more mixed than the domestic-industry framing usually suggests. American automakers installed 13,700 industrial robots in 2024, up 10.7% year on year, and automotive now accounts for around 40% of all new US industrial robot installations.
On robot density specifically, the US car industry ranks fifth in the world, tied with Japan and Germany—genuinely strong. But that strength is concentrated in one sector: across manufacturing as a whole, the US ranks only tenth globally on robot density, and most of the robots it installs are imported rather than domestically built.

Use of this image is permitted with a reference/backlink to this page
Sources: IFR World Robotics 2025, IFR press releases (2025 to 2026).
Manufacturing Cost and Labor
The labor-cost gap explains geographic concentration more directly than any tariff schedule. Oliver Wyman’s 2025 analysis of more than 250 assembly plants worldwide put Chinese manufacturers at $585 in labor cost per vehicle against $2,232 for European premium brands such as Mercedes-Benz, BMW, and Audi, a gap of nearly $1,700 per vehicle.
Mainstream manufacturers from the US, Europe, and Asia sat in between at $880 per vehicle, while dedicated EV-only makers, a group that includes Tesla, actually ran higher than the mainstream group, at $1,660 per vehicle, penalized by lower production volumes rather than higher wages.

Use of this image is permitted with a reference/backlink to this page
Sources: Thunder Said Energy, Caresoft Global, Oliver Wyman 2025, McKinsey, BloombergNEF.
| Worth flagging China is no longer the single cheapest place to build a car. Oliver Wyman’s own analysis names Morocco, Romania and Mexico as the new lowest-cost hubs, undercutting China on pure labor cost even as China remains the larger and more integrated manufacturing base. |
|---|
EV Manufacturing Investment and Workforce
US Investment and Jobs
Record investment announcements sit beside a falling US production share, and both things are true at once. Manufacturers have announced $197.6 billion in US EV and EV-battery manufacturing investment over the past decade, across 229 distinct investments at 208 facilities, supporting 194,600 announced jobs directly and potentially another 826,000 indirectly.
By the close of 2024, 57 of those projects were already in production, supporting more than 50,000 jobs, with over 100 more under construction, 69% of announced projects now showing on-the-ground results rather than sitting as paper commitments.
| Staat | Investment | Announced Jobs |
|---|---|---|
| Georgien | $26.4 billion | 31,600 |
| Michigan | $22.2 billion | 21,500 |
| North Carolina | $20.2 billion | 15,600 |
| Tennessee | $17.5 billion | 20,200 |
| Nevada | $16.5 billion | 12,900 |
Source: Environmental Defense Fund and WSP USA, U.S. Electric Vehicle Manufacturing Investments and Jobs, published January 2025 (data through close of 2024).
| Data honesty: announced does not equal deployed The $197.6 billion figure is cumulative announced investment, not confirmed spending. EDF’s own tracking shows 69% of projects have reached production or construction, which leaves roughly three in ten still at the announcement stage only. Treat announced and deployed capacity as two separate numbers, especially given how many EV-related announcements have been scaled back or delayed since late 2024. |
|---|
EU and Germany: A Workforce Transition Under More Strain than Forecast
This is the section where the most-cited older projections have aged badly. Thus, it is worth saying so plainly rather than repeating them. Multi-year-old modeling once projected EU automotive employment roughly tripling by 2030 as EV-sector jobs outgrew ICE losses.
The 2024 to 2026 reality has been considerably harder. Germany’s four largest automotive suppliers, Bosch, ZF Friedrichshafen, Continental and Schaeffler, collectively announced 54,000 job cuts in 2024 alone. This is a figure CLEPA describes as a record that surpassed the pandemic years combined.
Volkswagen separately confirmed plans to cut more than 35,000 of its roughly 295,000 German jobs by 2030. It is also the first time in the company’s history it has walked back a long-standing job-security pledge.
A CLEPA-commissioned PwC study puts numbers to the underlying mechanism: it forecasts 359,000 European ICE-powertrain jobs disappearing between 2030 and 2035. It warns that under a strict EV-only transition, 84% of the current 600,000 ICE-powertrain jobs become obsolete.
The roughly 226,000 new EV-powertrain roles that emerge do not come close to offsetting that, leaving a projected net loss of around 275,000 jobs even before counting wider supply-chain effects. That is a materially different picture from the “EV jobs will roughly triple” framing that circulated a few years earlier, and it is the one worth using now.

Use of this image is permitted with a reference/backlink to this page
Sources: EDF, Atlas Policy Institute, WRI, ManpowerGroup, ICCT, NGA, DTO Research, Rhodium Group.
EV Component and Precision Manufacturing
Beneath the OEM sales numbers sits the supply chain that actually makes the parts, and three threads run through it: rising CNC demand from powertrain complexity, the gigacasting shift, and a precision-parts market growing in lockstep with EV drivetrain complexity.
CNC Machining in EV Manufacturing
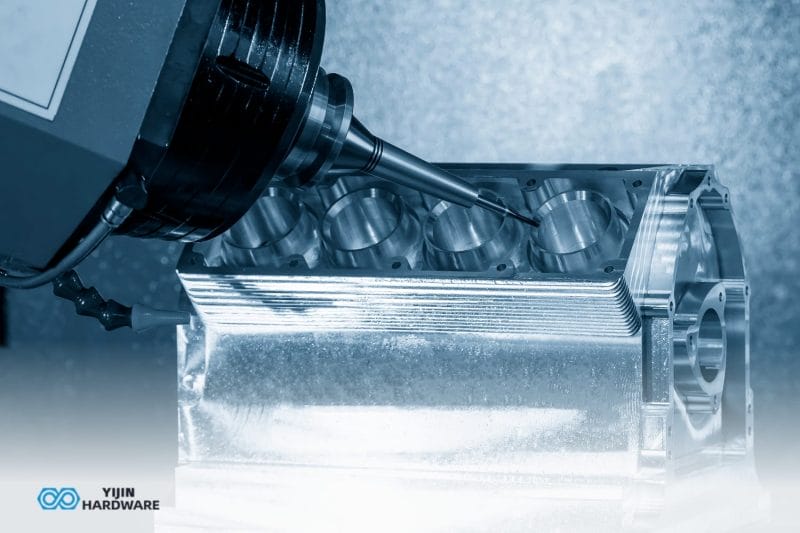
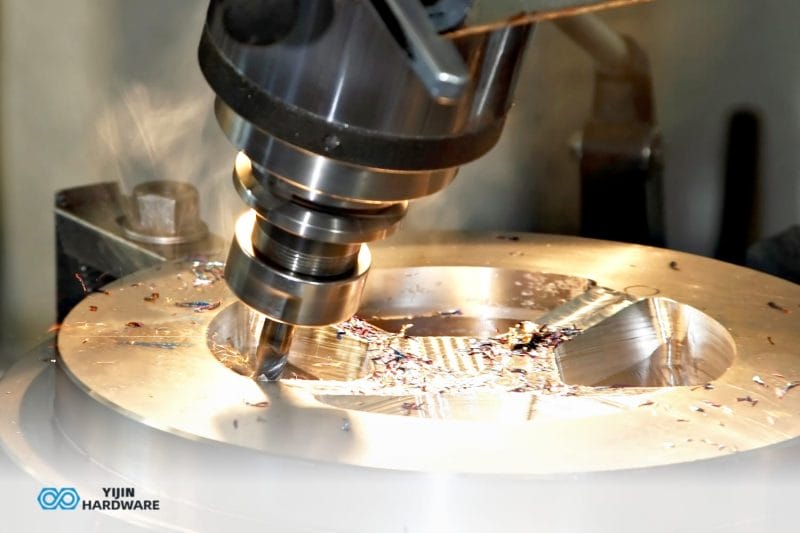
EV design trends drive multi-axis CNC demand directly. That’s because lightweighting and part-count consolidation raise part complexity even as total part counts fall. Mordor Intelligence sizes the global CNC market at $107.59 billion in 2025, growing to $165.95 billion by 2031 at a 7.32% CAGR. Tellingly, automotive is already the largest single buyer, taking 31.11% of 2025 spending.
The reason shows up in the tolerances: EV battery enclosures, motor casings and inverter heat-sinks need ±0.05mm accuracy over compound curves, a spec that only simultaneous 5-axis platforms hit reliably, which is why 5-axis capacity keeps taking share from simpler 3-axis lines industry-wide.
| A note on CNC market-size figures CNC market-size reports update almost monthly. Mordor’s own figure moved from $107.59 billion (2025) to $116.57 billion (2026) between report revisions between revisions. Any single CNC market-size figure is best read as a snapshot rather than a fixed number. |
|---|
Die Casting and the Gigacasting Shift
Gigacasting is arguably the most disruptive process change in automotive manufacturing since the moving assembly line, because it removes part count wholesale rather than trimming it at the margin.
A single casting can replace dozens of stamped and welded parts, cutting the robot count and weld-spot count on a given line accordingly. Tesla’s own Model Y frame casting is reported to have cut structural costs by roughly 40% through this consolidation.
Market-size estimates for gigacasting are genuinely all over the place, which is itself worth noting for anyone citing a single figure. Roots Analysis puts the market at $1.52 billion in 2025, rising to $7.04 billion by 2035 at a 16.58% CAGR, while other research firms tracking the same underlying technology put 2025 revenue anywhere from $160 million to $3.4 billion depending on scope (presses only, versus tooling, versus the full casting-cell package).
The direction is not in dispute. The specific number is scope-dependent, so the segmentation matters as much as the figure.
Precision Parts Market
Precision-parts growth tracks EV drivetrain complexity closely: EVs use fewer total parts than combustion vehicles, but each part carries tighter tolerance requirements. Within that market, CNC operations already hold 78.9% of precision machining, according to Grand View Research’s 2025 assessment, with milling the single largest machining type and automotive the largest end-use segment.
That combination is the clearest structural signal that EV manufacturing is pulling precision-parts demand toward multi-axis, closed-loop machining rather than away from it.
Yijin Solution provides CNC machining and high-pressure die casting for precision EV components, from powertrain housings and battery enclosures to structural castings.
EV Manufacturing Cost and the China Advantage
The battery’s roughly 50% share of EV value is the central cost factor in this whole industry, and the China-versus-West battery cost gap is most of the reason manufacturing concentration persists.
McKinsey’s benchmarking puts Chinese-made LFP packs at roughly EUR 64 per kWh against EUR 82/kWh for NMC packs, translating into a EUR 2,000 to EUR 4,000 per-vehicle cost advantage for midsize cars built in China compared with equivalent Western-built models.
Chinese OEMs achieve this partly through cell chemistry choice and partly through parts-count reduction and cheaper component sourcing, and McKinsey found the resulting cost advantage on comparable battery capacity can reach as high as 40% on a like-for-like basis.
| Worth noting Sourcing battery cells outside China for supply-chain resilience carries a real, quantified premium. McKinsey estimates components sourced from Europe, Japan, or South Korea run 15% to 30% more expensive than the Chinese equivalent, driven by higher energy and labor costs, smaller economies of scale, and pricier raw materials. That premium is the explicit price of diversification, not a rounding error. |
|---|
Critical Minerals and the Battery Supply Chain
Critical minerals bind everything above together: battery price, cell capacity, and gigafactory viability all trace back to lithium, cobalt, nickel, and graphite. Demand for these materials grew sharply again in 2024, with lithium demand rising nearly 30%, far outpacing the roughly 10% annual growth the 2010s saw, while nickel, cobalt, graphite, and rare earths grew 6 to 8%, according to the IEA’s Critical Minerals Outlook. Energy applications, EVs chief among them, drove the overwhelming majority of that growth.
The newest data point worth sitting with: global lithium-ion battery manufacturing capacity passed 4 terawatt-hours by the end of 2025, up roughly 30% on 2024, yet China still accounts for over 80% of that global total, with the EU and US holding just 6 to 7% each. Capacity is scaling everywhere; concentration is not easing nearly as fast as capacity is growing.
The Battery Raw Materials Bill
The annual metals bill for batteries sold shows exactly where cost pressure sits right now. The 2025 raw-materials bill for lithium, cobalt, nickel, graphite, and manganese in EV batteries came to $15.8 billion, a 13% rise on 2024, still roughly half the extraordinary 2022 peak, but clearly rising again.
Cobalt drove much of that: prices jumped after the Democratic Republic of Congo introduced export quotas, and cobalt’s share of the index rose to more than 14% ($2.4 billion), nearly back to its 2022 record despite years of automakers deliberately thrifting cobalt out of their cell chemistries. Nickel had its own milestone: the value of contained nickel in 2025 EV batteries topped $6 billion for the first time on an annual basis.
Manufacturing Emissions and Carbon Breakeven
BEVs start with a manufacturing carbon debt, mostly from battery production, and repay it during operation. How fast that debt gets repaid depends entirely on where the car is built and where it is driven, and the range is wide enough to change the answer to “is this car actually greener” depending on geography alone.
BloombergNEF’s lifecycle analysis found the breakeven point comes at just 25,000km in France, where the grid runs mostly on nuclear power, versus 153,000km in China. where coal still dominates electricity generation. That is roughly a sixfold difference in how long it takes the same technology to become the lower-carbon choice, purely as a function of grid mix.
Manufacturing carbon dioxide emissions from Chinese battery production run 60% to 85% higher than equivalent European or US production, and importing a China-built EV rather than building one locally can widen the breakeven distance by 60% to 80%.

Use of this image is permitted with a reference/backlink to this page
Sources: BloombergNEF Lifecycle Emissions, Statista, IEA, ABHA Foundation.
| The China carbon paradox China is simultaneously the cheapest place in the world to build an EV and the highest-carbon place to build one. As the grid there decarbonizes, that gap will narrow, but BloombergNEF’s own modeling shows it has not closed yet and will not fully close this decade even under the analysis’s more optimistic scenarios. |
|---|
EV Trade, Tariffs and Reshoring
As of April 2026, Chinese-built EVs entering the US face a cumulative effective rate of roughly 110 to 112.5%. This is a 100% Section 301 duty stacked with a 10% Section 122 surcharge and the standard 2.5% MFN passenger-car duty.
That is sharply lower than the roughly 245% ceiling briefly threatened during 2025’s tariff escalation, which several sources now confirm was never broadly applied. It is worth flagging given how often the higher figure still circulates. Either way, at just over 110%, the US market remains effectively closed to Chinese EV imports.
Europe took a different route entirely. The European Commission’s October 2024 countervailing duties vary by a manufacturer’s assessed subsidy level rather than applying a flat rate. Contrary to what many expected, a careful post-implementation price study found Chinese EV prices to EU consumers mostly fell rather than rose after the tariffs took effect, a sharp contrast with how US tariffs passed through to consumer prices during 2018 to 2019. Chinese manufacturers appear to have absorbed much of the duty to defend market share rather than pass it on.
None of this has reversed the underlying production map yet. Chinese exports doubled to more than 2.5 million vehicles in 2025 regardless of the tariff environment, and Chinese OEMs are routing around trade barriers by building locally: BYD shipped production equipment to a new Hungary plant in late 2025, with trial production expected in early 2026, and similar moves are underway in Turkey, Brazil, Thailand, and Indonesia.

Use of this image is permitted with a reference/backlink to this page
Sources: IEA GEVO 2026, CEPA, Contrary Research, ICCT, EDF, and CNBC.
EV Market Size and Forecasts
Headline market-value figures vary enormously depending on what each research firm counts as an “EV,” and the spread is worth understanding rather than picking whichever number sounds best. Precedence Research puts the global EV market at $988.70 billion in 2025, rising to $2,763.17 billion by 2035. Narrower scopes that count only pure battery-electric plug-in vehicles produce noticeably smaller numbers over the same horizon.
The 2035 spread across major forecasters runs roughly from $1.2 trillion to $2.8 trillion, and that gap is almost entirely a scoping difference (BEV-only versus all NEVs versus including hybrids) rather than a genuine disagreement about direction.
Emerging Battery Technologies
A handful of next-generation chemistries could reset these growth curves, though cost and manufacturing scale-up remain the binding constraint, not the underlying chemistry. Solid-state batteries currently cost 5 to 10 times more than conventional lithium-ion at equivalent capacity, and Toyota is targeting a 2027 launch for its first solid-state EV, promising roughly 1,200km of range and full charging in around 10 minutes if the timeline holds.
CATL and BYD are pursuing similar timelines domestically. Sodium-ion batteries are further along commercially and require no lithium at all, positioning them as a lower-cost option for entry-level segments rather than a range-leading technology.
Where EV Manufacturing Goes from Here
Volume forecasts converge more than dollar forecasts do, which is itself a useful sanity check when reconciling different sources. The IEA’s Stated Policies Scenario, its baseline, policy-as-announced case, puts the global EV fleet (excluding two- and three-wheelers) at around 245 million by 2030, meaning close to one in six light-duty vehicles on the road would be electric.
Its more conservative Current Policies Scenario, introduced in the newest 2026 outlook, still projects the global EV fleet exceeding 450 million by 2035, more than five times the fleet size at the end of 2025, even without any new policy support beyond what’s already announced. The direction is not really in question across any credible scenario; the disagreement is entirely about pace.
What the Numbers Mean
Three threads resolve most of the tension running through this article. This is analysis, not a recap of the individual figures above.
- Concentration and diversification are both true at once. China’s manufacturing lead grew during the exact years the West spent record sums trying to compete with it.
That is more of a timeline problem. Factories take three to five years to build; China is working from a fifteen-year head start and the world’s largest domestic market to amortize costs against.
Diversification into Mexico, Southeast Asia, and Eastern Europe is real and accelerating, but it runs on a decade-long clock. The US production-share numbers in this article are the clearest evidence that money alone does not compress that timeline.
- Price parity is a place, not a global fact. Battery cost parity with combustion vehicles is real in China, at $84/kWh and $585 in labor cost per vehicle. It is not real, on the same sticker-price basis, in North America or Europe, where batteries run 44 to 56% higher and labor costs run 1.5 to nearly 4 times higher depending on the comparison group.
“EVs have reached parity with ICE vehicles” is true in Shenzhen. It is not true in Detroit or Stuttgart. Any policy or investment decision built on a global parity assumption is building on a fact that only holds in one country.
- Manufacturing process innovation is outrunning policy. Gigacasting, multi-axis CNC consolidation, and battery chemistry shifts are all compressing the number of components and process steps per vehicle faster than any single government’s industrial policy is reshaping where those vehicles get built.
That compression shifts value toward precision partners capable of multi-axis machining, high-pressure die casting, and automated quality control, a capability question, increasingly, rather than a pure geography question, regardless of where the tariff walls end up.
Sourcing Precision Parts for EV Production?
EV manufacturing is pulling the precision supply chain toward tighter tolerances and consolidated, multi-axis parts, and the suppliers that can hold those specs at volume are the ones the transition rewards. Yijin Solution machines and die-casts precision EV components, from powertrain housings and battery enclosures to structural castings, at its Shenzhen facility inside China’s core EV cluster. If you are sourcing precision EV components, send your drawings for a free DFM review and quote.
EV Manufacturing Statistic FAQs
Which country manufactures the most EVs?
China, by a wide margin. It built 16 million electric cars in 2025, nearly 75% of global production, and supplied more than 80% of the world’s battery cells in the same year.
Who is the largest EV manufacturer in the world?
BYD overtook Tesla in 2025, selling 2,254,714 battery electric vehicles against Tesla’s 1,636,129. Counting plug-in hybrids too, BYD’s total NEV sales reached 4,550,036 for the year.
How many EVs were manufactured globally in 2025?
Almost 22 million electric cars, up more than 25% on 2024, according to the IEA. Sales, which are a different number, came in slightly lower at just over 20 million.
What is the largest EV battery manufacturer?
CATL, with a 39.2% global market share and 464.7 GWh installed in 2025. Together with BYD, the two Chinese firms control 55.6% of the global market.
How much have EV battery prices fallen?
Pack prices hit a record low of $108/kWh in 2025, 93% below 2010 levels, according to BloombergNEF. China’s own average sits lower still at $84/kWh.
Are Chinese EVs cheaper to make?
Yes, substantially. Chinese labor cost per vehicle averages $585 against $2,232 at European premium OEMs, and Chinese LFP battery packs run roughly EUR 64/kWh against EUR 82/kWh for NMC packs made elsewhere, a combined advantage McKinsey estimates at EUR 2,000 to 4,000 per vehicle.
Is the US closing the gap with China on EV manufacturing?
Not on current numbers. Despite $197.6 billion in announced US investment, the US share of global EV production fell from 7% to 5% between 2024 and 2025. Investment announcements and market share are moving in opposite directions.
What is gigacasting, and why does it matter?
Gigacasting is large-scale aluminum die casting that forms entire structural vehicle sections in a single piece, replacing dozens of stamped and welded parts. It is used by Tesla, BYD, Toyota, and a growing list of others, and Roots Analysis projects the market reaching $7.04 billion by 2035, though market-size estimates vary widely by firm depending on scope.
What are current US tariffs on Chinese EVs?
As of April 2026, roughly 110 to 112.5% cumulative, combining a 100% Section 301 duty with a 10% Section 122 surcharge and standard MFN duties. Tariff levels move often, so this reflects the April 2026 position.
Zurück zum Anfang: EV Manufacturing Statistics






 English
  Spanish
  German
  French