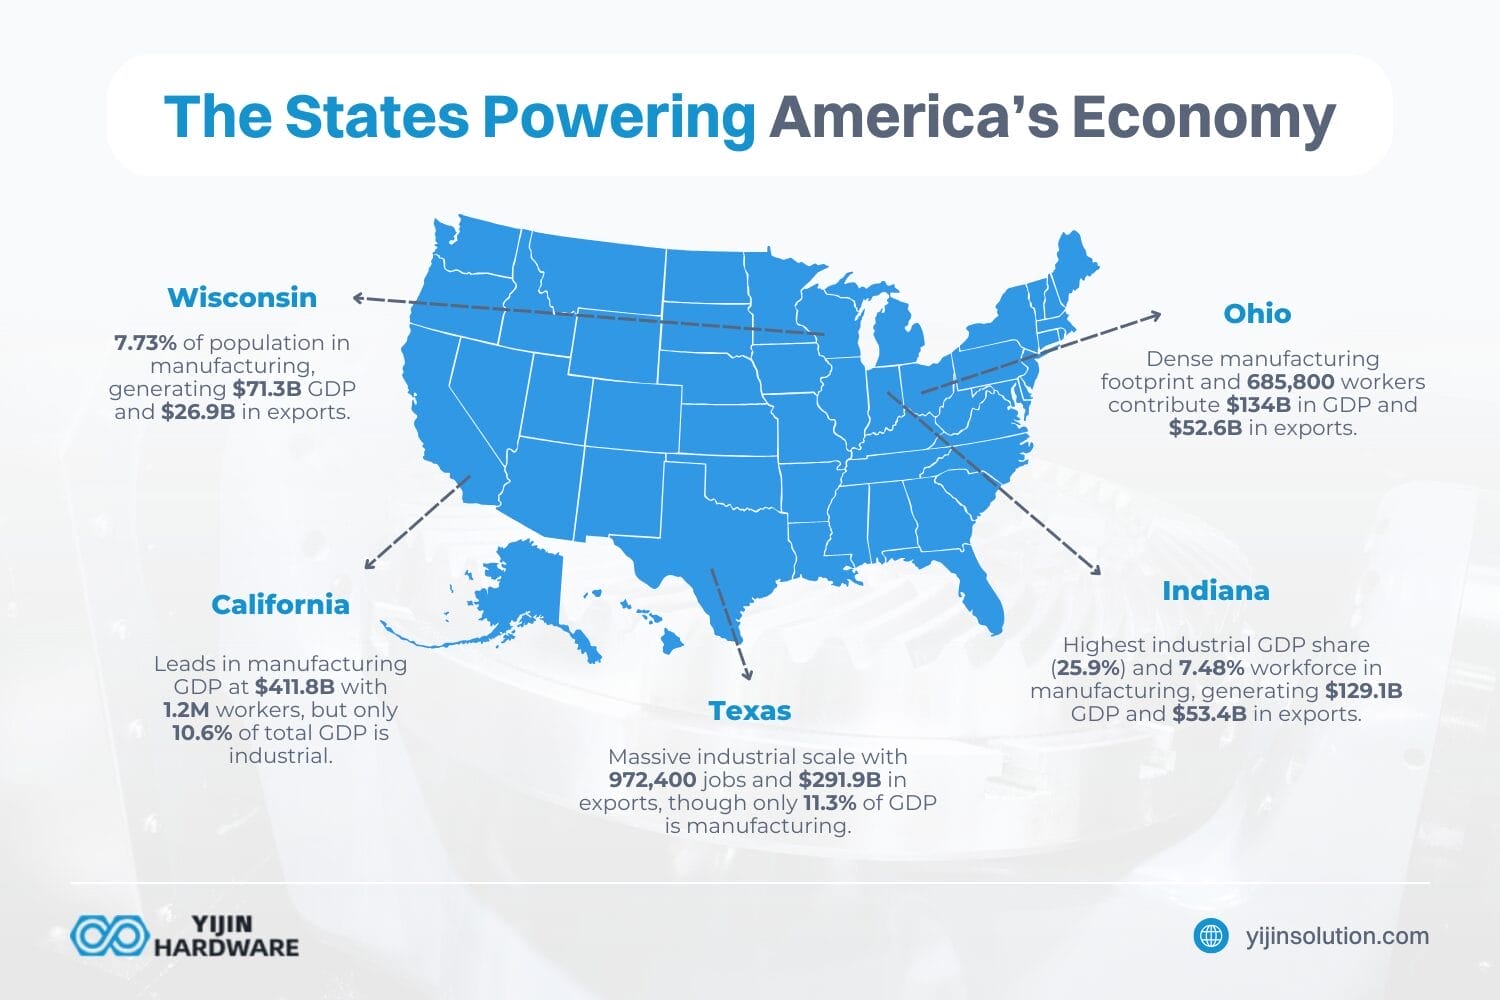
- Indiana is industrially the strongest state in the U.S. in 2025, standing out for its exceptionally high share of GDP and workforce tied to manufacturing.
- Manufacturer density reaches its highest in New Jersey, where over 80 producers operate per 100 square miles.
- States with high manufacturing employment don’t always export the most—California leads in GDP but lags in industry share.
A recent study by Yijin Solution created the state industrial strength score to identify the U.S. states most reliant on industry. The score is based on five equally weighted metrics: manufacturing GDP, industrial share of state GDP, export value, manufacturing employment share, and manufacturer density (manufacturers per 100 square miles). Metrics were sourced from federal economic and labor databases, with manufacturing share calculated per 100K population only during normalization.
Industrial Strength Score
| State | GDP from manufacturing | % of state GDP from manufacturing and industrial sectors | Worth of Exported Goods | % of population working in manufacturing | Number of Manufacturers per 100 miles² | Industrial Strength Score |
|---|---|---|---|---|---|---|
| Indiana | $129.1 Billion | 25.9% | $53.4 Billion | 7.48% | 22.0 | 100 |
| Texas | $292.6 Billion | 11.3% | $291.9 Billion | 3.05% | 7.8 | 92.03 |
| California | $411.8 Billion | 10.6% | $155.1 Billion | 3.10% | 22.0 | 91.12 |
| Ohio | $134.0 Billion | 15.1% | $52.6 Billion | 5.74% | 29.0 | 77.36 |
| Wisconsin | $71.3 Billion | 16.6% | $26.9 Billion | 7.73% | 13.7 | 74.46 |
| Michigan | $111.2 Billion | 16.5% | $62.0 Billion | 5.99% | 12.4 | 72.27 |
| Connecticut | $40.4 Billion | 11.7% | $14.7 Billion | 4.26% | 72.2 | 70.69 |
| New Jersey | $67.5 Billion | 8.4% | $38.4 Billion | 2.77% | 80.2 | 66.68 |
| Illinois | $135.1 Billion | 12.3% | $71.8 Billion | 4.47% | 22.4 | 65.57 |
| Iowa | $43.8 Billion | 17.2% | $16.2 Billion | 6.74% | 5.3 | 62.13 |
The full research is available here.
Industrial Strength Score U.S. States
Indiana
Indiana leads the nation with a state industrial strength score of 100, driven by an exceptionally high 25.9% of GDP tied to industry and 7.48% of its population in manufacturing jobs. The state supports 8,000 manufacturers with a distribution density of 22 per 100 square miles, generating $129.1 billion in GDP from manufacturing and exporting $53.4 billion in goods.
Texas
Texas ranks second with a score of 92.03, powered by a massive industrial economy that includes 21,000 manufacturers and 972,400 manufacturing jobs. The state leads in total exports at $291.9 billion, though industry makes up only 11.3% of GDP. With 7.8 manufacturers per 100 square miles, its industrial presence is spread across a vast geographic area.
California
California ranks third with a score of 91.12, backed by the largest manufacturing GDP in the country at $411.8 billion and a workforce of 1,228,100. Despite having 36,000 manufacturers and matching Indiana in density with 22 per 100 square miles, only 10.6% of its GDP and 3.10% of its population are connected to manufacturing.
Ohio
Ohio takes fourth place with a state industrial strength score of 77.36. It has 29 manufacturers per 100 square miles, one of the highest densities in the U.S., and 15.1% of GDP linked to industry. The state’s 13,000 manufacturers support 685,800 workers, contributing $134 billion in manufacturing GDP and $52.6 billion in exports.
Wisconsin
Wisconsin ranks fifth with a score of 74.46, showing strong manufacturing integration with 7.73% of its population employed in the sector. Its 9,000 manufacturers generate $71.3 billion in GDP, and its workforce produces $26.9 billion in exports, supported by a moderately high density of 13.7 manufacturers per 100 square miles.
Michigan
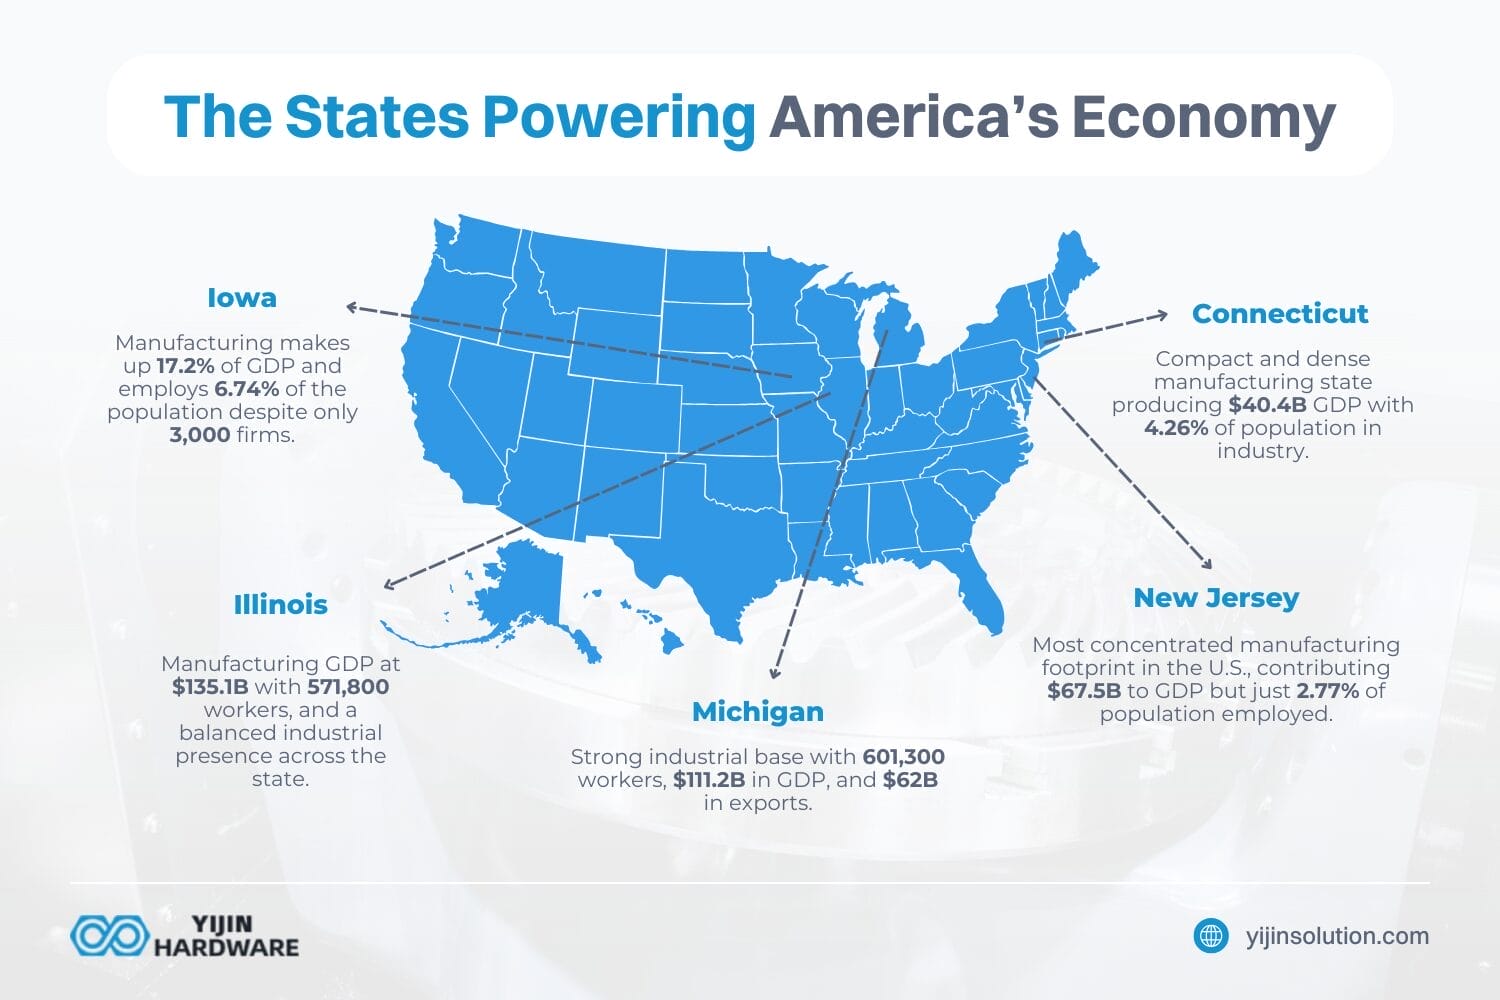
Michigan comes in sixth with a score of 72.27, maintaining a strong manufacturing base that includes 601,300 workers and a 16.5% GDP share from industry. Its 12,000 manufacturers contribute $111.2 billion in GDP and $62 billion in exports, with a moderate density of 12.4 per 100 square miles.
Connecticut
Connecticut ranks seventh with a state industrial strength score of 70.69. Despite its smaller scale, the state has one of the highest manufacturer densities in the nation at 72.2 per 100 square miles. It generates $40.4 billion in manufacturing GDP and employs 4.26% of its population in industrial roles.
New Jersey
New Jersey places eighth with a score of 66.68, driven by the highest manufacturer density of all states at 80.2 per 100 square miles. While $67.5 billion of its GDP comes from manufacturing, just 2.77% of the population is employed in the sector, showing a more concentrated industrial footprint.
Illinois
Illinois ranks ninth with a score of 65.57, combining $135.1 billion in manufacturing GDP with 13,000 manufacturers. Industry accounts for 12.3% of GDP, and the workforce includes 571,800 manufacturing employees, with a moderate density of 22.4 manufacturers per 100 square miles.
Iowa
Iowa rounds out the top ten with a state industrial strength score of 62.13. It has a notable 17.2% of GDP tied to manufacturing and employs 6.74% of its population in the sector. Despite having only 3,000 manufacturers, its small geographic size and high industrial share reflect a strong manufacturing orientation.
A spokesperson at Yijin Solution commented on the study: “Industrial economies are evolving, but this data confirms that traditional manufacturing hubs still hold significant economic weight – often in unexpected places. What’s especially striking is how some smaller or more densely populated states maintain their industrial relevance through strategic concentration and export specialization. These trends suggest that industrial infrastructure remains a foundational piece of many state economies, even in an era of service and tech dominance.”
Back to Top: 2025’s Industrial Leaders