 (+86) 188-2253-7569
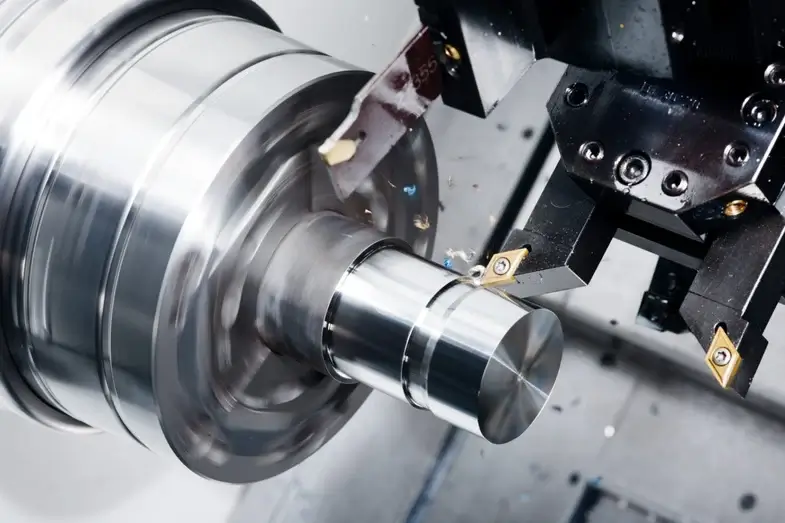
The iron-carbon phase diagram is a particularly important tool in metallurgy and materials science. Phase diagrams are graphical representations that give you essential insights into the behavior of iron-carbon alloys, especially steel and cast iron. This diagram shows you how temperature and carbon content affect the phases present in an alloy, which directly affects their mechanical properties and applications.
At Yijin Hardware, we are expert manufacturers committed to high-quality CNC machining. Let’s get into an in-depth explanation of the phase diagrams of metals, specifically the iron-carbon phase diagram, its applications, and more.
Key Takeaways
- The iron-carbon phase diagram helps you understand the relationship between temperature and carbon content in alloys.
- The phase diagram shows important phases like ferrite, austenite, and cementite, as well as transformations such as eutectoid and eutectic reactions.
- The diagram helps you develop new steel grades by allowing you to manipulate carbon content and heat treatment processes.
- Understanding the iron-carbon phase diagram is essential for perfecting manufacturing techniques to improve material performance.
What is a Phase Diagram?
A phase diagram is a graphical representation that illustrates the relationships between temperature, pressure, and composition. This equilibrium diagram was developed to visualize these relationships and make it easier to understand for a variety of purposes.
In metallurgy, phase diagrams of metals are important for understanding how different phases coexist under a few different conditions. The X-axis usually represents the composition (in weight percent), while the Y-axis shows temperature. More specifically, the iron-carbon phase diagram is used to show the interactions between iron and carbon across different temperatures and carbon concentrations.
Why are Phase Diagrams Important?
Phase diagrams are used to predict the phase transformations during heating and cooling processes. This gives you a more detailed look into microstructure changes that happen in alloys. In the iron-carbon system, this is helpful for understanding when austenite transforms into pearlite or cementite. This is essential for tailoring the mechanical properties of steel and cast iron.
By analyzing these diagrams, engineers can make practical choices for alloy design, heat treatment strategies, and processing conditions.
Applications of Alloy Phase Diagrams
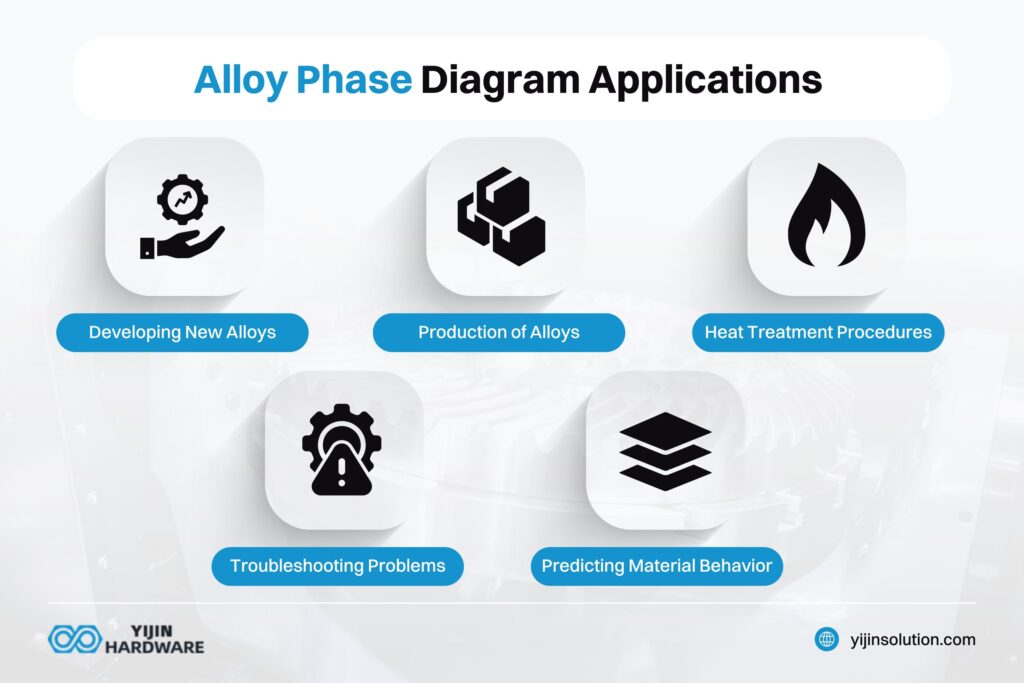
- Developing New Alloys: Phase diagrams help metallurgists design new alloys for certain application requirements. When you analyze the iron-carbon phase diagram, you can figure out the best carbon concentrations to produce certain mechanical properties like strength, ductility, and hardness.
- Production of Alloys: Understanding phase transformations is a significant aspect of producing high-quality alloys. The iron-carbon phase diagram guides manufacturers like Yijin Hardware in controlling cooling rates during solidification. This is done to achieve specific microstructures, like pearlite or martensite.
- Heat Treatment Procedures: The iron-carbon diagram plays an important role in creating heat treatment processes like tempering, annealing, and normalizing. These treatments improve the chemical, physical, and mechanical properties of alloys. This is done by setting up controlled transformations between phases.
- Troubleshooting Problems: When a problem comes up during alloy processing or application, a phase diagram describes possible causes and solutions. This means you can troubleshoot issues more easily because you’ll know how the changes in temperature or carbon content affect microstructure.
- Predicting Material Behavior: This phase diagram is also used to help engineers predict how materials will perform under different conditions. Being able to predict material behavior is important for making sure that applications are reliable and safe, especially for construction and automotive engineering.
The Iron Carbon Phase Diagram Explained
The iron-carbon phase diagram is used to describe the equilibrium relationships between iron (Fe) and carbon (C). This is done across temperatures and carbon concentrations up to 6.67%, which corresponds to cementite (Fe₃C). This Fe-C phase diagram is important for understanding how different phases form during heating and cooling processes in cast iron and steel.
In this equilibrium diagram, the X-axis shows you the weight percentage of carbon, while the y-axis shows you the temperature (°C). The diagram has several important points that represent different phases present at specific temperatures and carbon concentrations. Here is an example to help make it clearer for you:
- At low carbon concentrations (up to 0.008%), pure iron exists as α-ferrite.
- As the carbon content increases to around 2.1%, it changes into various forms of steel.
- Over 2.14% carbon content up to 6.67%, cast iron is formed.
The diagram also shows you important points like eutectoid (0.76% C at 727 °C), eutectic (4.3% C at 1,147 °C), and peritectic reactions. These give you more information about how these alloys will behave under different thermal conditions.
What are the Types of Ferrous Alloys in Phase Diagrams?
The types of ferrous alloys shown on the iron-carbon phase diagram can be grouped by carbon content into three categories: boundaries, euctectic point, and phase fields.
Boundaries
The diagram has a few major boundaries marked by lines labeled A1, A2, A3, etc. These show you the temperatures at which phase transformations happen during heating or cooling processes. These boundaries can help you identify when a material changes from one phase to another.
Eutectic Point
The eutectic point on the diagram happens at 4.3% carbon content at a temperature of 1,147 °C (2,097 °F). At this point, a liquid phase solidifies into a solid solution and mixture of austenite and cementite during cooling.
Phase Fields
The boundaries represent areas called phase fields, where specific phases exist under certain conditions:
- Hypoeutectoid Alloys: These have less than 0.76% C and mainly consist of ferrite and pearlite.
- Eutectoid Alloys: These have around 0.76% C. They cool from austenite at 727 °C, and then transform into pearlite.
- Hypereutectoid Alloys: These have more than 0.76% C and are made up of cementite along with pearlite when cooled.
Phases in the Iron Carbon Phase Diagram
The iron-carbon phase diagram represents a few specific phases. The phases of the iron-carbon alloy are important for understanding alloy behavior:
- δ-Ferrite (δ-Fe): This body-centered cubic (BCC) structure can be found at high temperatures above 1,495 °C (2,723 °F) with a maximum solubility of around 0.09% carbon.
- α-Ferrite (α-Fe): This phase is stable at room temperature with very low solubility for carbon, around 0.02%. That makes it soft and ductile.
- Ledeburite: Ledeburite is formed from eutectic reactions involving austenite and cementite. It is made of both phases at specific compositions.
- γ-Austenite (γ-Fe): This face-centered cubic (FCC) structure can dissolve up to 2.06% carbon at 1,147 °C (2,097 °F). Austenite is stable between 910 °C (1,670 °F), but transforms into other phases when it is cooled.
- Cementite (Fe3C): This is a hard and brittle intermetallic compound that is formed when carbon content is higher than 6.67%. Cementite is metastable within the iron-carbide system, and it greatly affects the hardness and brittleness of steel and cast iron.
- Martensite: This is a hard structure created by a quick quenching of austenite. It has a supersaturated solid solution of carbon in α-ferrite.
- Pearlite: Finally, this is a lamellar mixture of ferrite and cementite. It is formed through eutectoid transformation when austenite cools slowly below 727 °C (1,341 °F).
Yijin Hardware: Superior Performance
Yijin Hardware provides a wide range of manufacturing capabilities including injection molding, CNC machining, and laser cutting for prototyping and production. Get your instant quote today.
At Yijin Hardware, we understand that understanding the details of the iron-carbon phase diagram is important for ensuring superior performance in our CNC manufacturing processes.
We can optimize alloy compositions based on precise control over temperature and carbon content during production. Moreover, we ensure that our products meet high-quality standards while maximizing performance traits such as strength, ductility, and hardness. Get in touch for all your CNC machining needs!
Iron Carbon Phase Diagram: Explanation FAQs
What is the difference between an iron-carbon diagram and an iron-iron carbide diagram?
The iron-carbon diagram shows a wide variety of phases formed by iron and carbon, including iron and carbon; however, the iron-iron carbide phase diagram mainly focuses on the interactions between iron and iron carbide (cementite or Fe3C). Iron-carbon diagrams are more commonly used in metallurgy because they represent real-world steel and cast iron.
Which is the hardest phase in an iron-carbon diagram?
Cementite (Fe3C) is the hardest phase in an iron-carbon diagram, due to its brittle, intermetallic nature. Cementite significantly increases the hardness and wear resistance of steels, but its brittleness reduces toughness. Managing cementite through heat treatments can balance hardness with other properties like ductility and flexibility.
What is the softest phase of iron?
Ferrite (α-Fe) is the softest phase of iron. Its body-centered cubic (BCC) structure makes it highly ductile and malleable, so it is a key component in low-carbon steels known for their formability.
Back to Top: Iron Carbon Phase Diagram: Explanation