info@yijinsolution.com
 (+86) 188-2253-7569
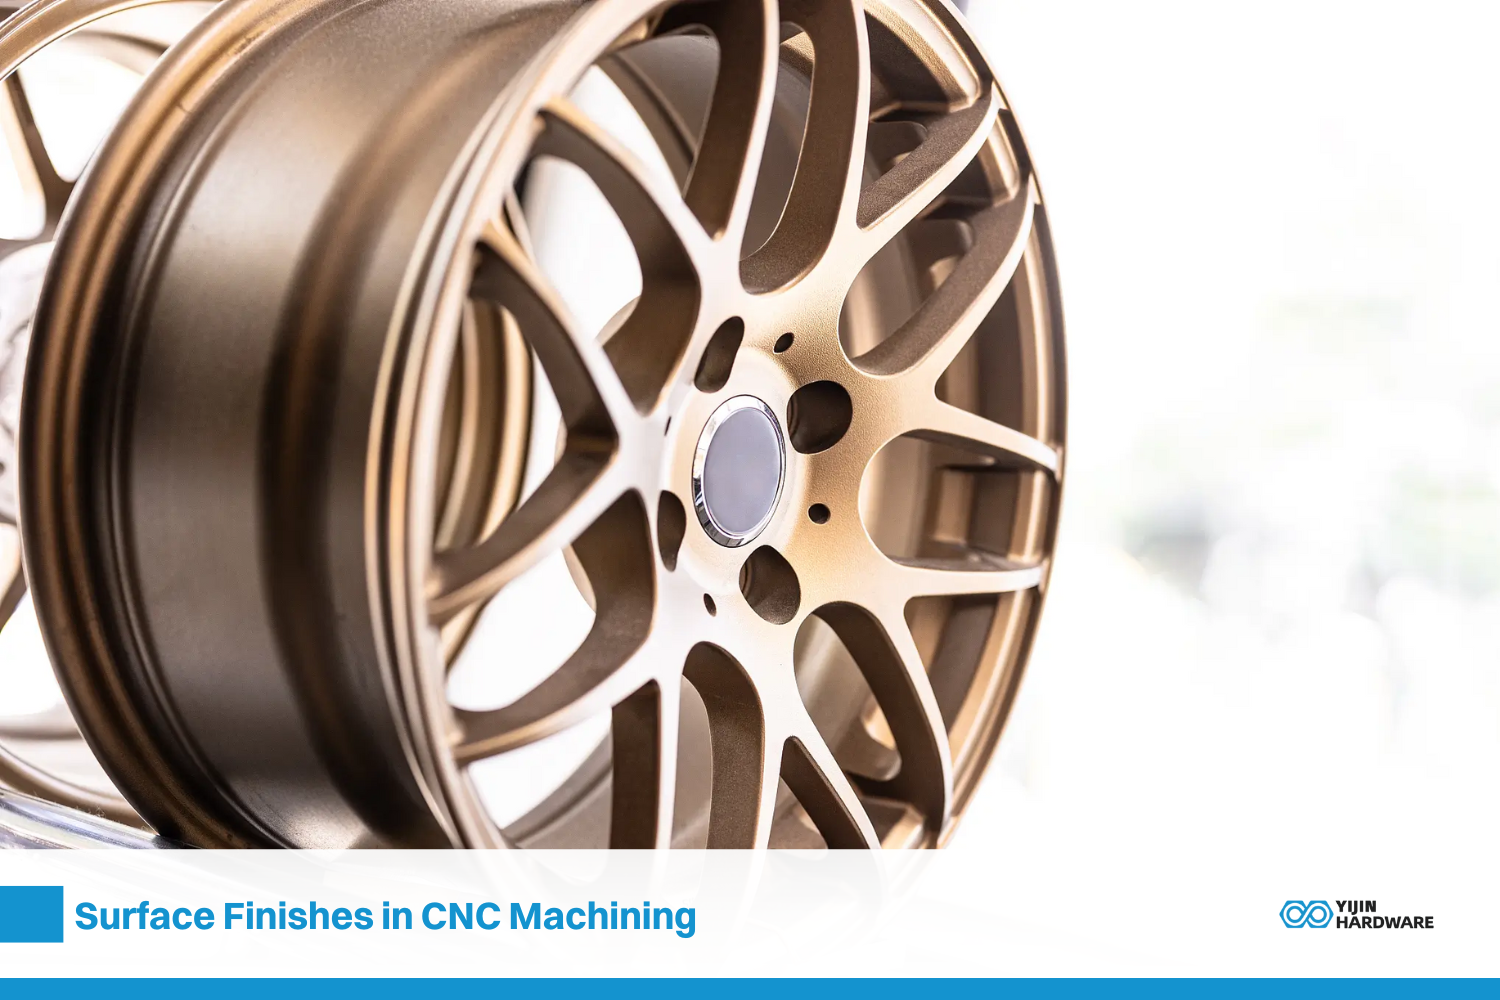
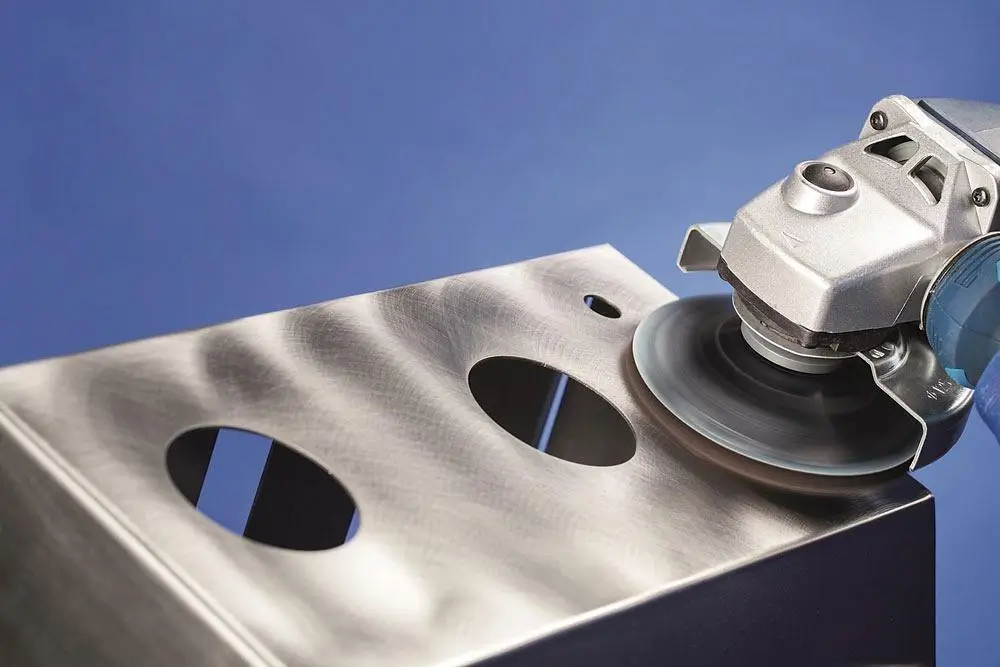
Surface finish in CNC machining is defined as the texture and smoothness of machined exterior parts. It is an important parameter that affects not just appearance but also mechanical properties and performance of the part. CNC surface finish plays a critical role in determining functionality, performance, durability and appearance of the final product.
It’s important to tell the difference between surface finish and surface finishing. Surface finish is the natural texture as a result of CNC machining process while, surface finishing means extra processes applied to change surface properties in order to protect and improve surface appearance. This article discusses the different aspects of surface finishes in CNC machining such as types, methods, preparation and selecting the right finishes.
What Is Surface Roughness?
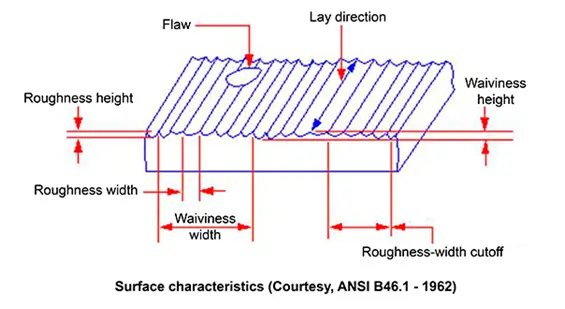
Surface Roughness is defined as the texture and irregularities on a machined surface in a CNC machining surface finish. It measures the microscopic peaks and valleys during the manufacturing process. The most common parameter used to measure surface roughness is Ra (average roughness). Different roughness values are needed for different applications and typically measured in micrometers (μm).
- Ra (average roughness)- It is the most widely used criteria for measuring the average height of surface irregularities
- Rz (mean roughness depth)- The Average max peak to valley height of the surface profile.
- Rt (total roughness) – The Maximum peak to valley height of the entire measured surface
SPI and VDI Finish Standards:
Two commonly used standards for specifying surface finishes in CNC machining are the SPI Standard Finish (Society of the Plastics Industry) and VDI (Association of German Engineers) grades.
1. SPI Finish Standard
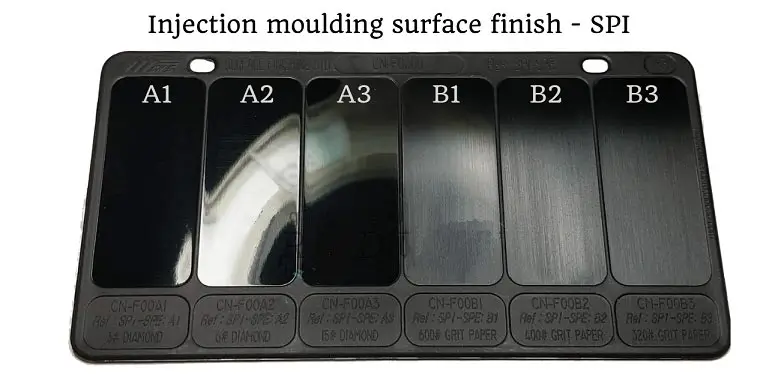
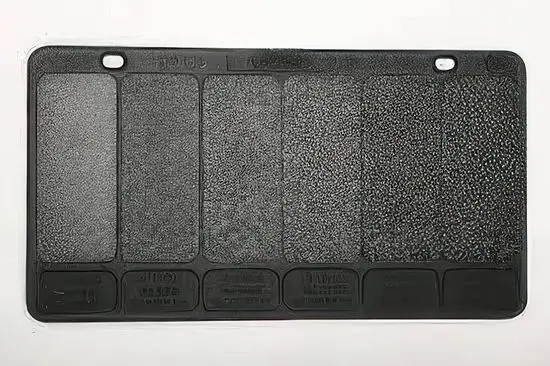
The SPI standard has defined 12 grades of surface finishes across four categories such as A1, A2, B1, B3 and C1, C3. These grades are widely used in mold making and plastic injection molding. A1 and A2 grades are the highest quality finishes produced by diamond buffing that are suitable for optical surfaces. B1 and B3 grades represent semi-fine finishes produced as result of stone polishing finishes that are good for visible plastic parts. C1 and C3 grades denote medium finishes created by paper polishing which are normally used for less visible or non-cosmetic parts.
The following table summarizes these grades:
| Category | Grade | Description | Surface Roughness (Ra) |
| Glossy (A series) | A1 | Super High Glossy | 0.012 – 0.025 μm |
| A2 | High Glossy | 0.025 – 0.05 μm | |
| A3 | Normal Glossy | 0.05 – 0.10 μm | |
| Semi-Glossy (B series) | B1 | Fine Semi-glossy | 0.05 – 0.10 μm |
| B2 | Medium Semi-glossy | 0.10 – 0.15 μm | |
| B3 | Normal Semi-glossy | 0.28 – 0.32 μm | |
| Matte (C series) | C1 | Fine Matte | 0.35 – 0.40 μm |
| C2 | Medium Matte | 0.45 – 0.55 μm | |
| C3 | Normal Matte | 0.63 – 0.70 μm | |
| Textured (D series) | D1 | Satin Textured | 0.80 – 1.00 μm |
| D2 | Dull Textured | 1.00 – 2.80 μm | |
| D3 | Rough Textured | 3.20 – 18.0 μm |
2. VDI finish standard:
The VDI 3400 standard developed by German Engineers is often used in Europe and Asia. It relates with surfaces produced by Electrical Discharge Machining (EDM). The VDI scale ranges from VDI 12 to 45 and lower numbers indicate smoother surfaces.
Some key VDI grades are presented in the following table:
| VDI Grade | Surface Roughness (Ra) | Equivalent/Description |
| VDI 12 | 0.40 μm | Equivalent to SPI C-1 |
| VDI 18 | 0.80 μm | Satin finish |
| VDI 27 | 2.24 μm | Dull finish |
| VDI 36 | 6.30 μm | Dull finish |
| VDI 45 | 18.00 μm | Very rough finish |
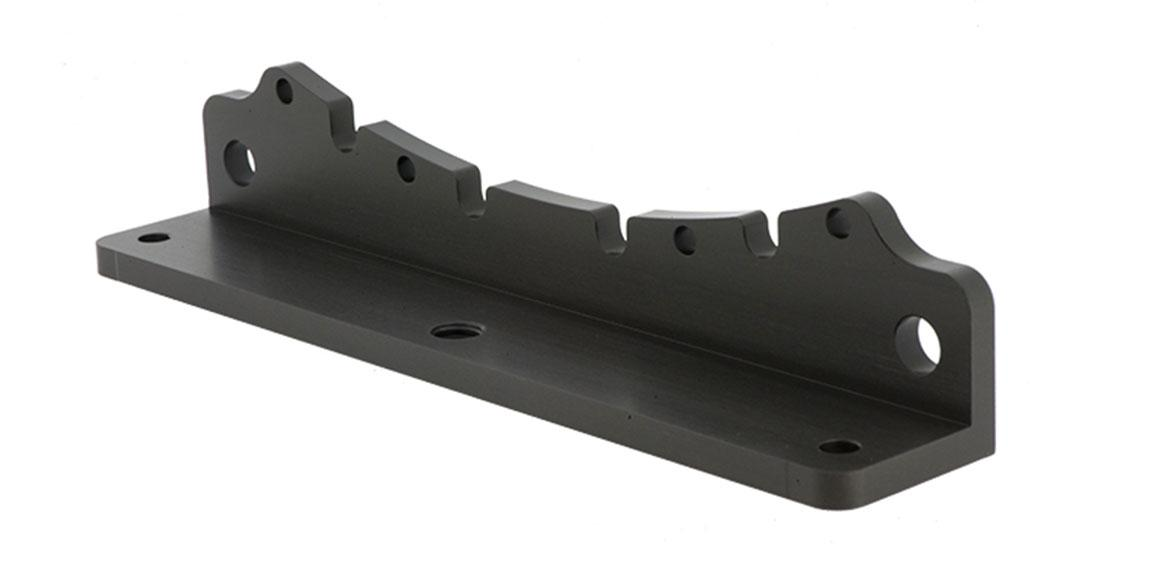
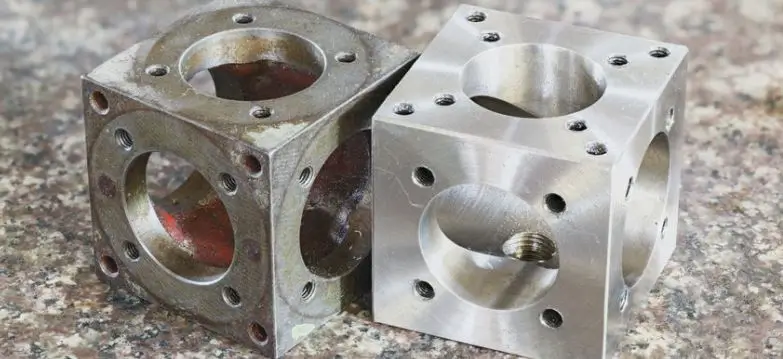
As-Machined Finish
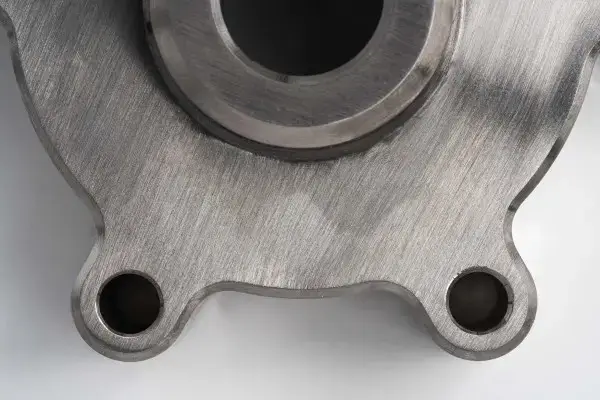
As-machined finish is defined as the default surface texture and quality directly resulting from the CNC machining process, without any extra finishing treatments. This CNC surface finish is distinguished by visible tool marks and average surface roughness that often changes depending on the machining settings and tooling used.
Industry standards use specific Ra values to decide the quality and requirements of machined finishes such as:
- 2 μm Ra – A Standard machine finish which is good for most consumer parts.
- 6 μm Ra – A Finer finish with very faint cut marks which is suitable for tight fittings and mildly load-bearing surfaces
- 8 μm Ra – A High-quality finish for parts under concentrated stress.
- 4 μm Ra – The lowest and finest available grade which is best for fast rotating parts like bearings and shafts.
Pros and Cons of As-Machined Finish
| Pros | Cons |
| Tightest tolerances | Visible tool marks |
| Cost-effective (no additional processing) | Lacks protective coating |
| Suitable for non-aesthetic parts | Rougher surface texture |
| Maintains original material properties | May not meet aesthetic requirements |
| Ideal for prototyping and initial testing | Potential for reduced wear resistance |
| Enhances adhesion for bonding or coating | May not be suitable for high-precision applications |
Types of Surface Finishing Options
Various surface finishing methods are applied to achieve the desired surface characteristics the well-known surface finishing options are mirror like polishing for precision optics and powder coating for durable outdoor equipment. This section comprehensively covers the important types of CNC machining surface finishes.
The table below discusses the various types of surface finishes:
| Finishing Method | Technique | Materials | Reason for Use |
| Mechanical | Polishing | Metals, Plastics | Creates mirror-like finishes |
| Mechanical | Shot Peening | Metals | Improves fatigue resistance and stress corrosion |
| Chemical | Electroplating | Metals | Adds protective or decorative coatings |
| Chemical | Electropolishing | Stainless Steel, Aluminum | Smooths and passivates metal surfaces |
| Chemical | Passivation | Stainless Steel | Enhances corrosion resistance |
| Chemical | Chemical Milling | Metals | Selectively removes material for complex shapes |
| Thermal | Laser Polishing | Metals, Ceramics | Achieves high-quality finishes on complex geometries |
| Thermal | Plasma Polishing | Metals | Rapidly smooths surfaces without mechanical contact |
Shot Peening
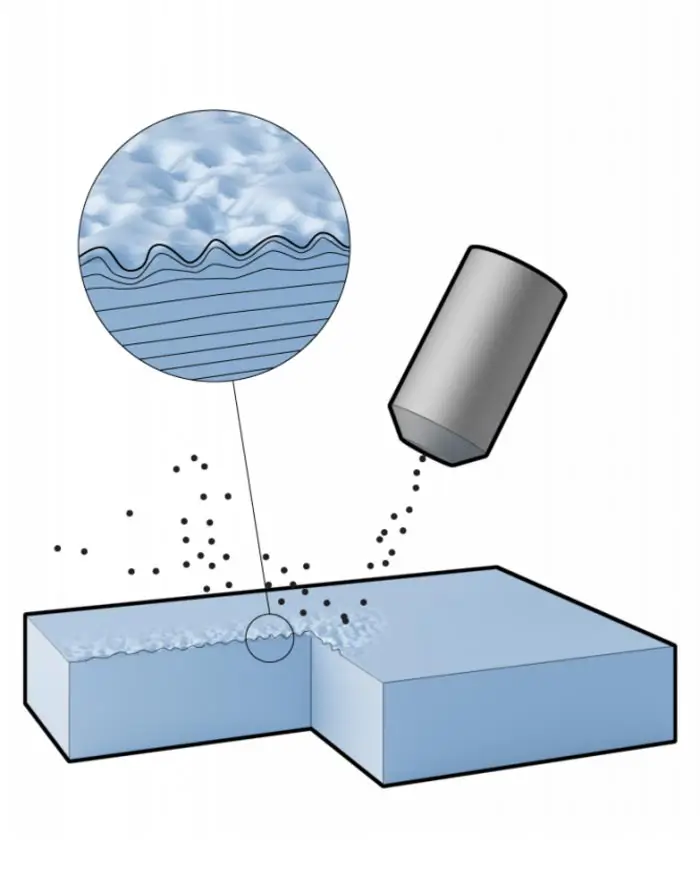
Shot peening is a surface treatment that increases fatigue strength and stress corrosion resistance. During the process, Small spherical media (shot) are bombarded onto the surface at high speed (30-100 m/s). Operators control the shot flow and intensity with specialized equipment such as the Almen Strip Test which is also used to measure process effectiveness. This process improves material properties and creates a uniform and slightly textured surface which is valuable for components subject to cyclic loading.
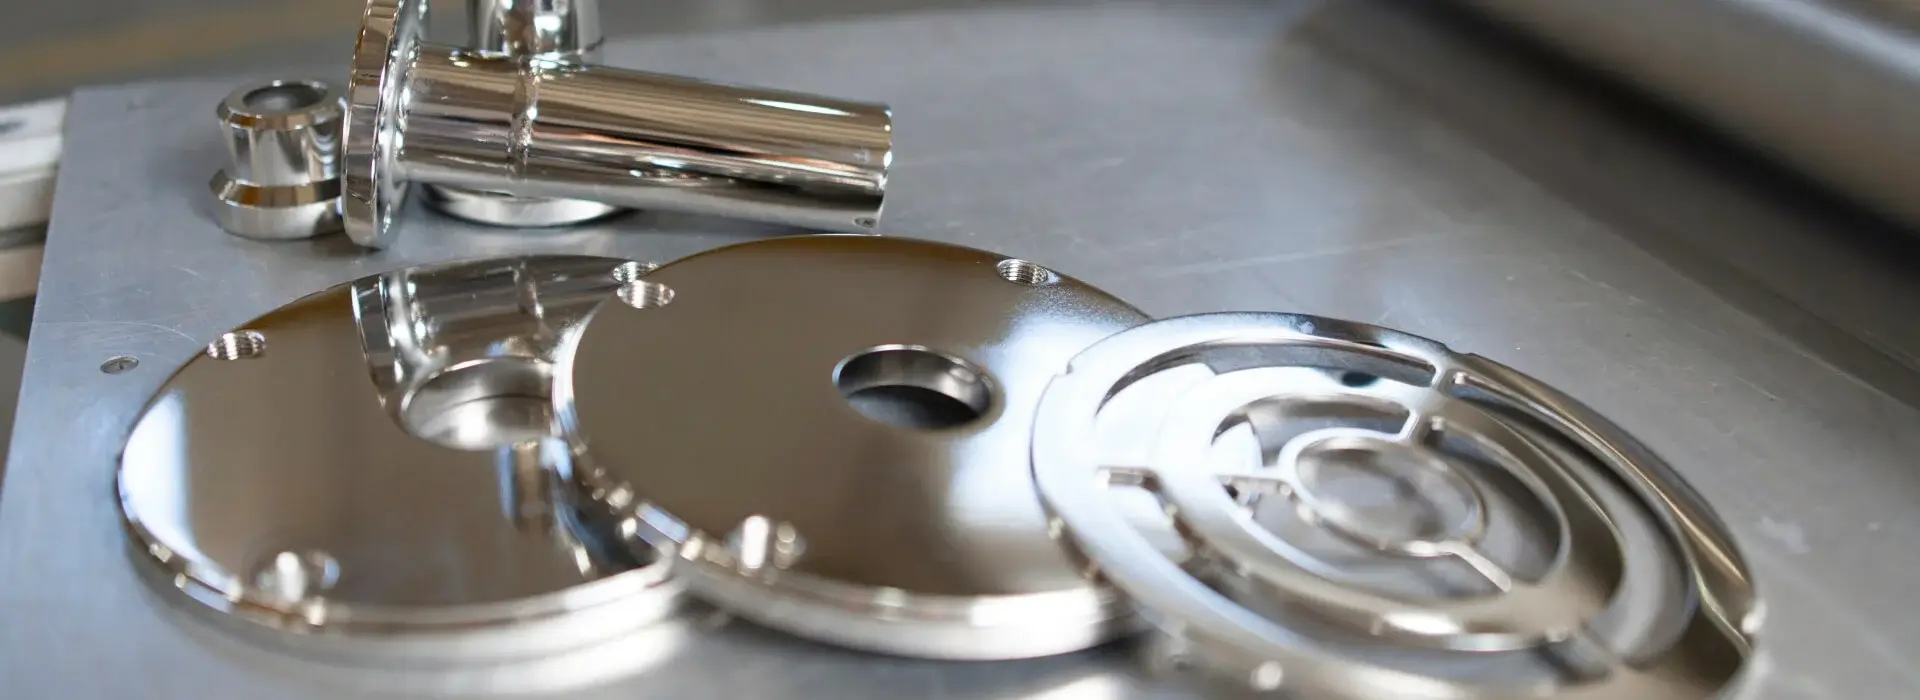
Electroplating
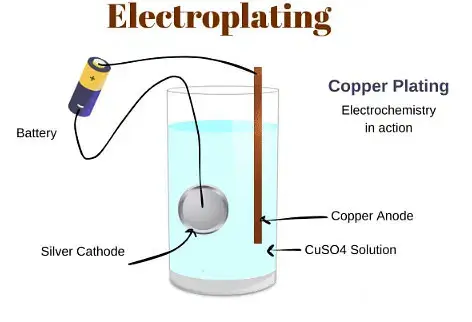
Electroplating is a well-known surface finishing technique that deposits a thin metal layer onto a substrate using electric current. The process starts by soaking the workpiece (cathode) and metal source (anode) in an electrolyte solution containing dissolved metal ions. When electric current flows, metal ions from the solution are reduced and deposited on the cathode surface forming a uniform coating. Electroplating can increase corrosion protection, wear resistance and decorative finishes. Common plating metals used in electroplating are gold, silver, nickel, copper and chromium. Thickness and quality of the plating can also be controlled by adjusting factors like current density, temperature and plating duration control.
Electropolishing
Electropolishing is an electrochemical process that removes a thin layer of material from a surface for smooth and bright finish. It involves submerging the part in an electrolyte solution and applying electric current. Operators carefully control the current density and exposure time to get the desired material removal and surface smoothness. This technique works very well for improving corrosion resistance and creating clean sanitary surfaces on stainless steel, and other corrosion resistant alloys. Electropolishing can remove up to 40 micrometers of material from a surface depending on process parameters but typically removes between 8 to 20 micrometers.
Passivation
Passivation is a chemical treatment that improves the corrosion resistance of some metals by forming a protective oxide layer. The technique is typically done by dipping the part in an acid solution (often nitric or citric) to remove surface contaminants and promote oxide formation. Operators also control the solution concentration, temperature and dipping time for best results. The process is commonly used on stainless steel and other corrosion resistant alloys to increase resistance against environmental factors without altering the dimensions. The process has four main steps: cleaning, chemical application, rinsing and oxidation to form the passive layer. For example, stainless steel parts are typically held 20-30 minutes at temperature between room temperature and 65°C (149°F).
Powder Coating
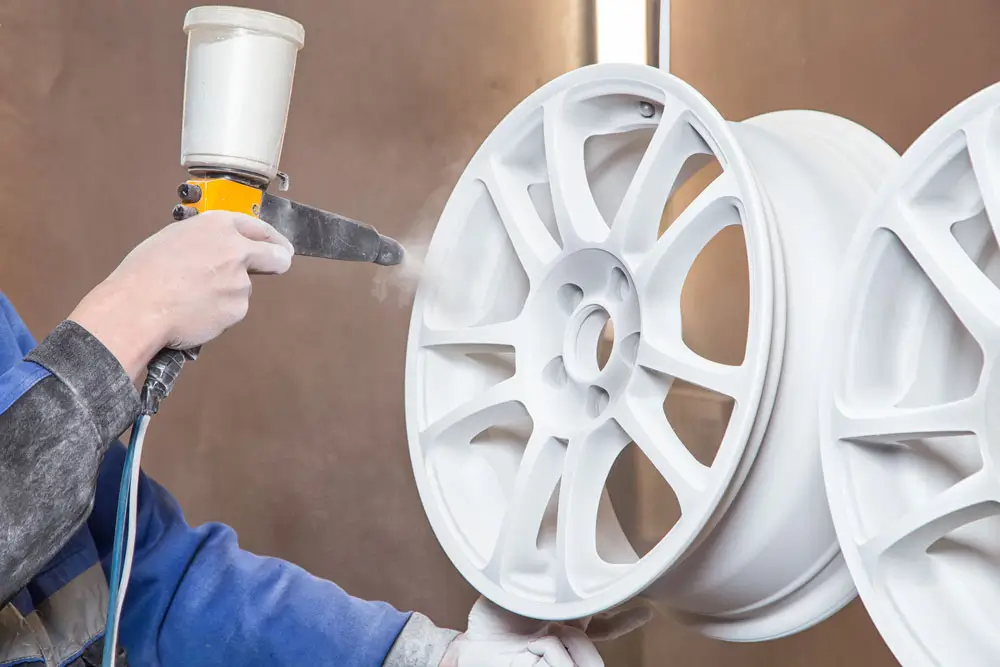
Powder coating applies a dry powder electrostatically, then cures it with heat to make a durable, uniform coating. It achieves a coating thickness of 30-130 μm which provides excellent corrosion protection (up to 3000 hours in salt spray tests). The process is widely used for outdoor equipment, car parts and appliances. The process is more eco-friendly since it doesn’t use any solvents and allows easy recycling of overspray. Various powder types such as polyester, epoxy and hybrids have unique properties like UV resistance, hardness and flexibility.
Laser Polishing
Laser polishing uses a focused laser beam to melt and redistribute the surface material to create a smooth finish. The technique involves scanning a laser beam across the surface in a controlled pattern. Operators adjust the parameters like laser power, scan speed and beam focus to obtain desired surface finish quality. This process is effective for complex geometries and hard to reach areas because of the ability to reach Ra values as low as 0.1 μm without any mechanical contact. It is a versatile option for various materials and applications as it works well with metals, ceramics, and some plastics.
Choosing custom laser cutting metal services not only ensures precise dimensions but also reduces surface imperfections, making it easier to achieve the desired finish with minimal post-processing. This synergy between cutting and finishing is key to creating high-quality parts for demanding applications.
Plasma Polishing
Plasma polishing, also called plasma electrolytic polishing, utilizes an ionized gas to remove material and smooth the surface of conductive materials. The process involves soaking the part in an electrolyte solution and applying high-voltage current to create a plasma discharge around the workpiece. Operators control the voltage (typically 300-600V), electrolyte temperature (50-80°C), and processing time (1-6 minutes) to get the wanted surface finish. This method is very successful for deburring and smoothing intricate shapes to produce a uniform surface, with less roughness and better corrosion resistance. Plasma polishing is primarily used on conductive metals and is an alternative to traditional mechanical polishing methods.
Pre-Finish Preparation
Proper preparation is needed for the best CNC surface finish. This involves several key steps:
- Use specialized tapes and plugs to shield areas that should not be affected during finishing processes.
- Use solvents, ultrasonic cleaning, or vapor degreasing to remove oils. While coolants and metal chips are used to reduce heat and friction.
- Deburr edges with manual tools or machines to improve safety and finish quality.
- Create a uniform surface texture by chemical etching or mechanical abrasion.
Choose The Right Surface Finish for Your CNC Machining Projects
The right surface finish can improve part’s functionality, longevity and overall quality. Here are tips for choosing the right surface finish for your CNC machining projects:
1. For parts that need tight dimensional tolerances or where looks are not important, as machined surface finish is often the most cost-effective choice. This method works well for functional prototypes or internal components.
2. When a uniform matte finish is required or minor surface issues need addressing, bead blasting is an excellent choice. It also improves appearance and prepares surfaces for more finishing processes.
3. Powder coating is preferred for parts that require a durable, corrosion-resistant finish with color options. The process is suitable for outdoor applications.
4. Polishing is a suitable choice when a smooth and reflective surface is desired for aesthetic or functional reasons. The process also reduces friction and improves corrosion resistance.
5. Electroplating is used when better surface hardness, wear resistance or conductivity are required for a project.
6. For aluminum parts that need corrosion protection, wear resistance and better aesthetics, anodizing may be a good choice. This method also increases durability and allows for color options.
Read More:
Alumiun Surface Fnishes Options
Yijin Hardware: Machining Expert for Your Custom Surface Finishes
If you need help in selecting the right surface finish for your specific project you can contact Yijin Hardware. Our experts have 20+ years of experience in the machining field and have worked with all kinds of surface finishes. They can help you decide the best surface finish according to your project requirements.